
Exposing the loci of bias: a taxonomical exploration of sources of bias in population mental health research

The objective of systematically categorizing sources of bias calls for an alternative tree structure. Loci of bias refer to specific points or sources where bias can originate or be observed. The tree structure presented in Fig. 2 contains branches that enable a distinctive clustering of the various areas or factors contributing to biased observations. At the highest level, loci can be divided into “material” and “procedural” sources of bias, linked respectively to the substance or composition of the mental health aspect of interest (what to assess) and to the techniques used to capture or extract information (how to assess it). The material loci group into two clusters: one focused on the nature of the “outcome”, and another comprising biases sourced from three subclusters—vulnerability, exposure, and population characteristics—which delineate the “context” of the outcome. The procedural loci also form two clusters: “data collection” and “analysis”, both of which involve methodological sources of bias as a common denominator. At the lowest level of the tree structure (to the right in Fig. 2), the distinctive loci of bias are displayed. These will be described in the following sections.
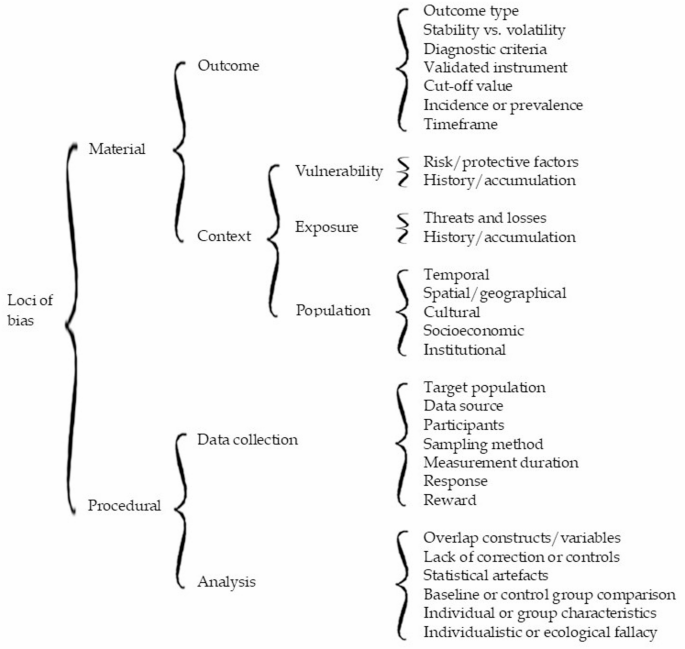
Material loci of bias
Two clusters of material loci can influence the substance or composition of mental health issues being assessed in epidemiological studies.
Material cluster 1. outcome
When it comes to outcome type, several options exist. The outcome may refer to general health status—such as well-being or overall functioning—or it may involve a specific mental health issue. Outcomes can also range from severe disorders like major depression, anxiety disorders, posttraumatic stress disorder (PTSD), or prolonged grief disorder, to subclinical phenomena like symptoms of depression, anxiety, PTSD, grief, suicidality, or general distress. The type of outcome assessed matters greatly: the number of identified cases—whether healthy or unhealthy—will depend on the outcome definition and vary substantially across categories.
The question of whether psychological conditions are individual traits (stable, enduring) or states (temporary, situational) has been the subject of scholarly debate [13, 14]. This distinction is highly relevant in mental health impact assessments. To determine whether an event, situation, form of exposure, or intervention has a probable health impact, it is essential to know whether the measured health aspect is stable or volatile over time. If the outcome is inherently changeable or prone to daily or seasonal fluctuations, attributing its variation to an exposure, intervention, or other factor becomes problematic—especially when attempting to distinguish between short- and long-term effects. Symptoms—and emotions, whether considered symptoms or not—can indeed be volatile when monitored [15, 16], whereas disorders or chronic conditions are generally characterized by more persistent patterns of symptoms, lasting for months or years, and often requiring professional care.Footnote 1
When the outcome of interest involves a formal condition, standardized diagnostic criteria are required for reliable assessment. In practice, leading models such as DSM-5 and ICD-11 often produce similar estimates. For example, in the case of probable PTSD, diagnostic criteria appear applicable across various event types. However, as these models are periodically revised, disorders evolve, and studies based on different versions can yield incongruent results [17].
Given the particularities of diagnostic criteria in mental health, validated measurement instruments should be used whenever possible. Ideally, these instruments are validated in the same language or cultural context—or even better, in the specific population—where the assessment is conducted.
Instrument developers typically recommend specific cut-off values to determine whether a respondent’s score indicates a serious risk or exceeds a diagnostic threshold. These cut-offs are based on balancing sensitivity and specificity for a given population. However, when the same instrument is validated in a different population, the optimal cut-off may change [18, 19]. This can have serious implications. Different cut-off values lead to variation in estimates and raise questions about bias and comparability across samples. The recommended cut-off might be based on a biased sample, warranting caution in accepting “gold standards” without scrutiny [20].
Another issue is whether the assessment reflects the number of new cases (incidence) or the total number of cases over a time period (prevalence). Though both can be derived from the same data, they are conceptually different. Prevalence, incidence, and condition duration are interrelated in a steady-state population such that two of these can be used to estimate the third [21]. When comparing incidence rates and prevalence proportions across sources, it is important to consider the operational definitions used and their implications [22]. Ignoring these distinctions can introduce bias into calculated averages or pooled estimates. The prevalence-incidence bias is of at least potential importance in any assessment where a time gap exists between exposure and the selection of study subjects [2].
A final potential source of bias in this outcome cluster is the timeframe covered by the assessment. Timeframes can range from “current” to the past month, year, since the start of the COVID-19 pandemic, or lifetime [23,24,25,26]. Population estimates have been shown to differ significantly depending on the timeframe applied [17, 25], likely influenced by memory limitations and recall bias [27, 28].
Material cluster 2. context
At least three contextual subclusters of loci can be identified that have a confirmed influence on estimated mental health outcomes.
Contextual subcluster 1: vulnerability
The first subcluster consists of factors indicative of the vulnerability (and vulnerability history) of individuals within a population. Risk and protective factors (or health determinants)—including age, sex or gender, degree of actual and perceived social support, education, income, and pre-existing health conditions—have been extensively described in the literature, either in general terms [29,30,31], or specifically in relation to disasters and trauma-related mental health problems [26, 32,33,34,35,36].
Contextual subcluster 2: exposure
The basic hypothesis is that individuals and groups with an increasingly unfavourable combination of vulnerabilities will be more susceptible to the consequences of a second contextual subcluster: exposure to adversity [37]. Exposure can manifest in multiple forms [34, 38, 39]. Primary exposure ranges from events and situations where people are confronted with (probable) death, serious injury or the loss of loved ones. The list of possible primary exposures is extensive: toxic substances, terrorism, war and armed conflict, epidemics and pandemics, earthquakes, storms, airplane, train or ship disasters, traffic accidents, and physical or sexual violence. Though causal attribution of exposure, its causes, and its health consequences remains challenging [40, 41], the profound impact of disaster exposure on mental health is well established [32, 34, 35, 42, 43]. The type of exposure matters [26, 28, 35], including its long-term impact [44]. – [45] Furthermore, repeated, accumulating, or chronic exposure—indicative for exposure history—is associated with increased mental health problems [46,47,48,49,50].
Additionally, it is important to “look beyond the flame” of primary exposure and account for secondary exposure. Williams and colleagues argued that most secondary stressors are a function of social factors and people’s life circumstances (including the policies, practices, and social, organisational, and financial arrangements) that exist prior to and impact them during the major incident as well as societal and organisational responses to an incident or emergency. These stressors are accompanied by increased mental health risks. [51,52; also see 34].
Exposure can differ across phases of the disaster timeline. Multiple studies have documented the mental health impact of evacuation and relocation [53, 54]. House loss or housing damage also affects mental health and well-being [55,56,57], and losing a job can have a stronger effect than losing a home [57]. The challenge lies in avoiding the pitfall of oversimplifying exposure and approaching it as a single, independent event. In real-life circumstances, exposure is a complex and dynamic combination of threats and losses.
Contextual subcluster 3: population
The third contextual subcluster includes factors that are part of the broader setting of the assessed population and are confirmed to be connected to mental health. This includes temporal factors—the point in time when an assessment is conducted. Emotions and mental health problems have been shown to vary across different phases [15, 34, 35, 43], as do the composition of exposure and vulnerability factors and the needs and problems of the affected population [58,59,60]. There may also be seasonal effects, such as holiday periods when people are unavailable for surveys or unable to visit their healthcare providers. Apart from these exceptions, a coherent and growing knowledge base documents mental health trajectories following exposure to potentially traumatic events and losses, including disasters and pandemics [35, 42, 61, 62]. Typically, the most common trajectories indicate resilience or recovery in the first months and years. More generally—and relevant from a long-term vantage point—several longitudinal studies indicate a gradual deterioration of mental health in general populations over time [63,64,65,66]. From a temporal perspective, such broader patterns must be taken into account when reviewing the short- and long-term impact of specific events and exposures.
Multiple studies emphasize the importance of spatial and geographical factors—such as the proximity of risk and actual exposure [35, 67]. Some cross-national comparisons point to regional differences, for example, those based on WHO regional classifications [68]. However, interregional variation may be linked to other loci, particularly cultural, socioeconomic, and institutional factors.
In terms of cultural factors, several studies report associations between cultural values or dimensions and mental health [69, 70], as well as variation in mental health stigma across countries [71, 72]. Other studies have verified associations between cultural and socioeconomic dimensions [73, 74].
Socioeconomic factors themselves can be sources of bias. When it comes to serious mental health problems, there appears to be a paradoxical relationship: population studies in less vulnerable, wealthier countries report higher prevalence [75,76,77,78,79,80,81]. Conversely, well-being and individual symptoms such as sadness, worry, or unhappiness often show more favourable outcomes in wealthier contexts [82]. – [83].
A final source of bias, embedded in the population context, relates to institutional factors stemming from historical or recent policy decisions. These influence the approach to social determinants of mental health, both contributing to inequalities and helping to explain differences between populations. As Kirkbride et al. describe:
“Social determinants of mental health encompass the set of structural conditions to which people are exposed across the life course, from conception to death, which affect individual mental health outcomes, and contribute to mental health disparities within and between populations. These structural conditions include factors such as income, employment, socioeconomic status, education, food security, housing, social support, discrimination, childhood adversity, as well as the neighbourhood social and physical conditions in which people live, and the ability to access acceptable and affordable health care.” [84].
In other words, through a wide-ranging network of social determinants, institutional factors not only shape vulnerability but also influence access to prevention, diagnosis, and treatment across primary, secondary, and tertiary healthcare systems—issues that are highly relevant for those seeking to assess and understand population mental health.
Procedural loci of bias
The two clusters within the procedural loci comprise data collection and analysis.
Procedural cluster 1. data collection
Data collection centres around a selected target population—a group of individuals of interest. This may include the general population (adults or children and adolescents), with or without a specific focus on exposure to a risk, situation, or event, ranging from illness to disaster. Practically, data collection may involve recruiting selected participants from a community, patients from a psychiatric hospital or clinic, survivors of an airplane disaster, or bereaved parents. These populations vary in their accessibility. In particular, help-seeking samples can be informative for identifying healthcare needs, but the representativeness of such assessments is inherently limited.
Data sources may include diaries, interviews, social media posts, questionnaires, patient records, health registries, or laboratory data. Each of these sources comes with its own potential biases, tied to its quality [85] and depending on what facilitates or obstructs the inclusion of participants’ mental health in the assessment. Health registries and patient records, for example, typically capture the tip of the iceberg, as they reflect more enduring and clinically relevant health issues and related healthcare utilization. In contrast, social media content and population surveys can provide insight into mental health experiences outside the medical domain.
The actual participants also matter. Each participant is a representative of a specific target group whose mental health is being recorded. The data recorder may be the participant themselves, or another actor—for example, a parent responding on behalf of a child [86, 87], a trained lay interviewer [88], or a healthcare professional routinely logging patient data as part of clinical documentation [89,90,91]. The identity and training of the recorder can itself contribute to bias [92,93,94].
The sampling method used to approach participants is a fundamental source of bias. Sampling methods are broadly categorized into probability and non-probability sampling. Probability sampling ensures that each member of the population has a known chance of being selected, allowing for statistical inference about the entire group. Non-probability sampling, in contrast, involves non-random selection techniques such as convenience sampling, snowball sampling (e.g., among hard-to-reach groups like unregistered immigrants or the homeless), or purposive sampling based on judgment or criteria. While these methods are often easier and quicker to implement, they reduce representativeness and increase the risk of bias [95]. As a result, certain vulnerability, exposure, or population characteristics may be over- or underrepresented in the sample. Non-probability sampling has been found to overestimate the prevalence of mental health problems [78].
The measurement moment can also influence assessments. Timing within a week, season, or year, the phase in a disaster timeline [43, 58, 96, 97], the state of the economy [98], or pre-existing mental health trends [63,64,65,66, 80] may all be shaping population mental health.
A related factor is measurement duration. Data collection may be extended when dealing with large or hard-to-reach populations. In some cases, data collection spans a year or longer [99, 100]. Over such timeframes, fluctuations—whether meaningful trajectories or seasonal effects—are collapsed into averages, limiting the utility of the data for understanding longitudinal developments.
Response rates also affect the representativeness and validity of assessments. Some members of the target population may be unwilling or unable to participate in a survey, may drop out before completing it, or may be unavailable or lost for follow-up [101]. These patterns of non-response may be random or systematic, and can even correlate with broader country-level socioeconomic characteristics. For example, a correlation of 0.71 (p <.001) was found between response rates and a national vulnerability index in a cross-national PTSD study of 24 countries [75]. Contrary to what might be expected, the emotional burden of a trauma-related survey does not appear to negatively affect responses to subsequent trauma and non-trauma surveys, and therefore does not bias study outcomes [102].
Incentives can be used to increase participation. Financial incentives (e.g., cash, gift cards, discounts) or free services may persuade individuals to participate. These effects are well-documented [103,104,105]. While not inherently problematic, incentives may introduce systematic response bias if they disproportionately attract individuals with vulnerability or exposure profiles linked to elevated mental health risks. A less tangible incentive—particularly relevant in population health research related to specific risks—is the sense of recognition participants may feel when their experiences are acknowledged. This is especially salient when institutions, governments, or media are perceived as downplaying or ignoring health and safety concerns. Even when concerns are legitimate and assessments are conducted in good faith, self-selection of highly motivated individuals may result in biased outcomes.
Lastly, sample size, while not strictly a source of bias, is relevant in this context. In many cases, representativeness—which may be affected by the loci above—is more critical than the number of participants. Larger samples can reduce random error but are not a safeguard against systematic bias. As Kaplan and colleagues have pointed out:
“There are many circumstances in which very large studies include systematic biases or have large amounts of missing information, and even missing key variables. Large sample size does not overcome these problems: in fact, large sample studies can magnify biases resulting from other study design problems.” (Kaplan et al., 2014) [106].
In this sense, sample size also determines the capacity to explore and mitigate other sources of bias in subsequent analyses.
Procedural cluster 2. analysis
This brings us to the final cluster, which highlights sources of bias arising from the analysis of collected data. While analysis can be an effective tool to reduce bias, it can, ironically, also introduce it.
A first source of potential analysis-induced bias concerns the degree to which health outcomes and predictors can be treated as distinct entities. Overlapping constructs or variables can seriously compromise both quantitative and qualitative analyses. Multiple outcomes of interest may be intertwined, even if they are approached as separate entities and measured with validated tools. These tools might still capture characteristics of other mental health conditions. When predictor variables suffer from similar overlap, associations with outcomes may become tautological. Ultimately, several concepts measured in a single assessment might all serve as proxies for a participant’s general well-being, incorporating a substantial amount of shared variance. Treating them as independent phenomena may be more problematic than it appears.
The loci of bias explored in this contribution are, in principle, neither rare nor isolated; rather, they are jointly embedded in every mental health assessment. Consequently, greater absence of corrections or control measures should be viewed as an overarching source of bias. The value of a study increases when deliberate steps are taken to prevent or reduce such biases, or to plausibly rule them out. This principle applies equally to systematic reviews and meta-analyses. Ideally, assessments of methodological quality and bias should be conducted (as outlined in PRISMA checklists) [7]. Despite the availability of international frameworks, tools, and guidance, researchers still calculate pooled prevalence estimates without simultaneously controlling for relevant biases—even though appropriate statistical techniques are available [43, 107, 108]. These concurrent corrections are crucial to avoid wrongly attributing effects to a single factor that may actually be confounded by another.
Statistical artefacts are not real relationships or effects; they are distortions or misinterpretations caused by the way data is handled or analysed. Examples include the type of rotation used in exploratory factor analyses, the technique for identifying latent classes, multilevel data structures, the distribution shape, model appropriateness, treatment of outliers, data transformations, imputation strategies, weights used to suggest representativeness corrections, and unchecked multicollinearity or confounding. Each of these can contribute to underfitting or overfitting models, inflated variance, and other forms of biased estimation—whether due to neglect or deliberate choices.
A baseline or control group is necessary when the goal is to assess change in an outcome over time or following a particular exposure, such as a disaster or healthcare intervention [66, 109,110,111,112]. In such cases, however, the reference group may be subject to similar sources of bias as the study group.
One particular analytical challenge is distinguishing which characteristics belong to individuals and which to the groups they belong to. This distinction is critical both at the level of a single observation and in longitudinal studies, where isolating within-individual changes from group-level noise is essential [113].
A final pitfall to avoid is falling into the trap of individualistic or ecological fallacies [114, 115]. An individualistic fallacy occurs when group-level conclusions are incorrectly based on individual data (e.g., just because some people develop PTSD after a disaster does not mean everyone does). An ecological fallacy occurs when conclusions about individuals are drawn from group-level data (e.g., a higher PTSD prevalence among women in a population does not imply that all women are at increased risk individually).
link


")
